
Quickstart
In this guide, we'll import a shapefile and create a simple project to view and collect data.
Getting Started
For this guide, you'll need:
- GeoSync GO account with administrative access
- Zipped Boston subway data - Download
Upload Data
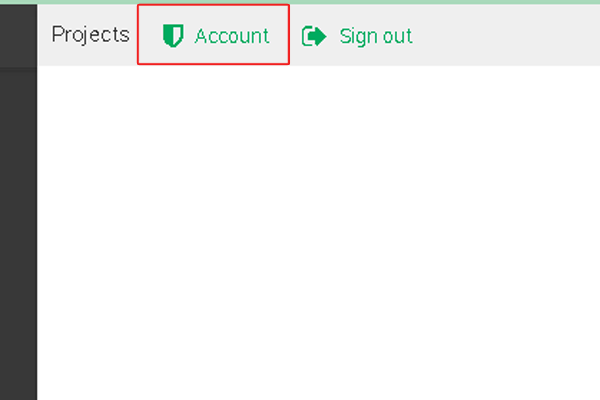
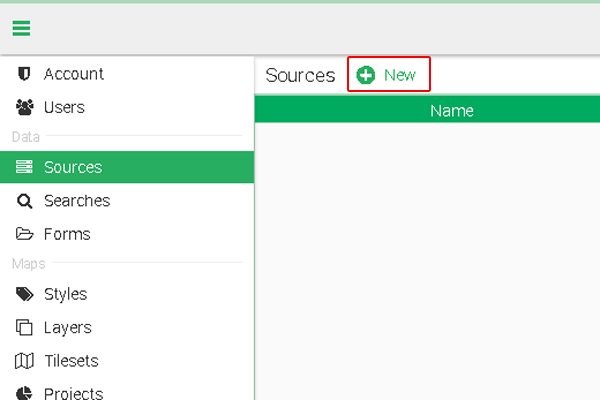
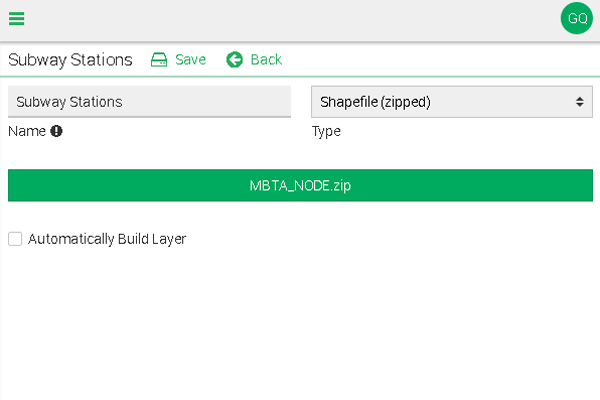
Log in on your GeoSync GO account. At the top of the dialog window, click the Account link. Click on the Sources link in the left menu. Click the New link at the top to open the creation form. For this demonstration, set the name to Subway Stations and the type to shapefile. Use the Choose a file button to browse to the subway data zip file on your computer. Click the Save link at the top to create the new source.
Create Layer
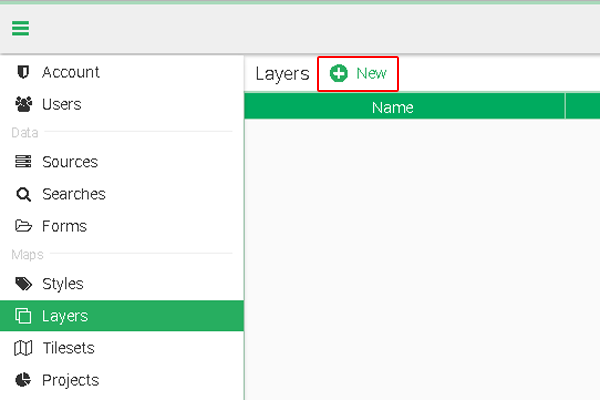
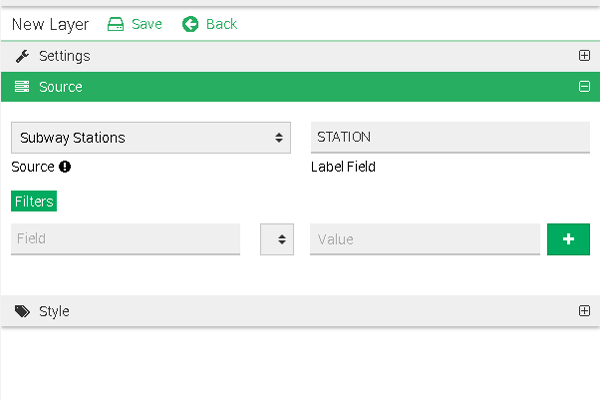
Go to the Layers section in the left menu. Click the New link at the top to open the creation form. Set the name to Subway Stations and then expand the Source section. In the Source dropdown, select the Subway Stations source we just created. Click into the Label Field. This will give you a list of feature properties. Select STATION from the list. We will leave everything else the same for now. Click the Save link at the top to create the layer.
Import Tileset
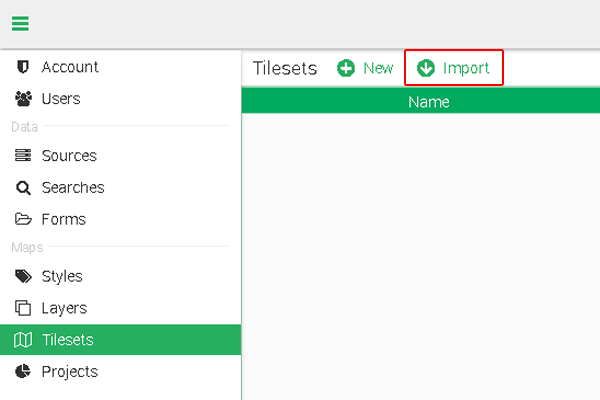
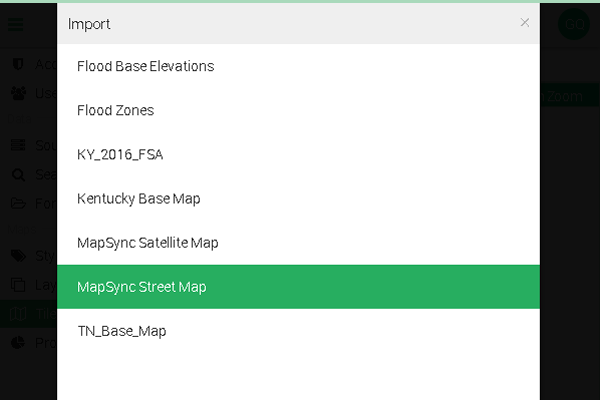
A tileset is the background tiles for your map. This can be custom tile caches, but for this quickstart we will use an existing tile service. Click Tilesets in the left menu. At the top, click the Import link and choose MapSync Street Map from the list.
Build Project
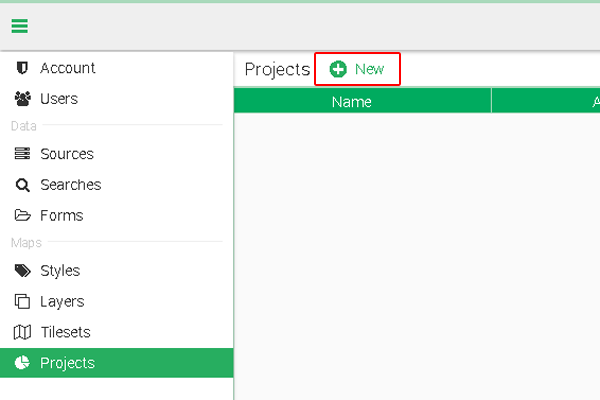
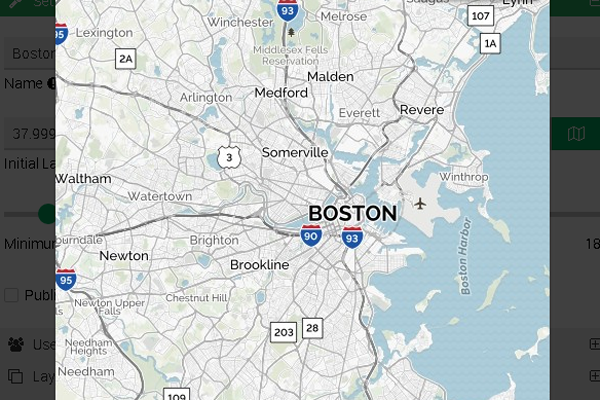
Now we put the pieces together to generate a map. Click on Projects in the left menu. Click the New link at the top to open the creation form. Set the name to Boston Subway. On the Initial Latitude, click the map button to the side of the input. This will display a map. As you zoom and pan the map, it updates the initial start up location of project. For this exercise, we need to pan to Boston and set the zoom to 11. Then close the map with the X in the top right corner.
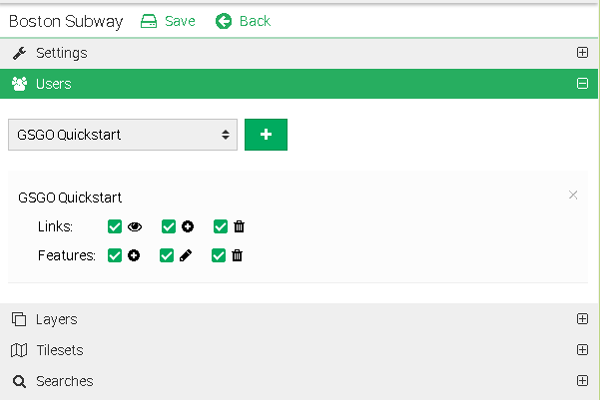
The next section is Users. Here you can determine who has access to your project. For simplicity, we will just add one user. In the dropdown, select your account and then hit the + button. The user list will be below and you can check all the boxes to have full permissions.
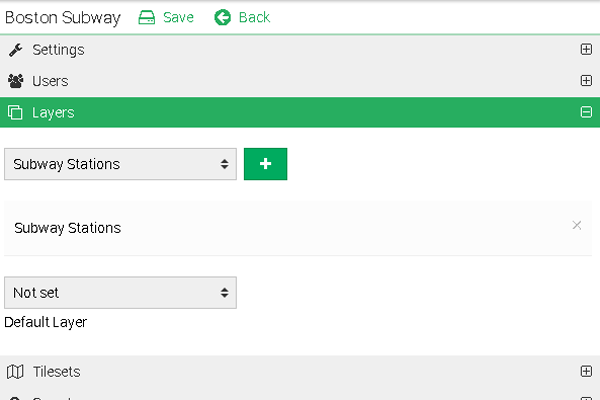
The Layers section is where we will add our layer created above. In the dropdown, select the Subway Stations layers and click the + button. Likewise, in the Tileset section, choose the MapSync Street Map option and click the + button.
This will be all we need for our simple project and we can click the Save link at the top.
Understanding the Map
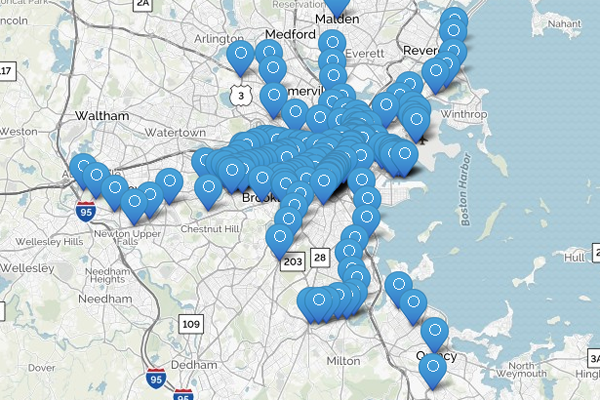
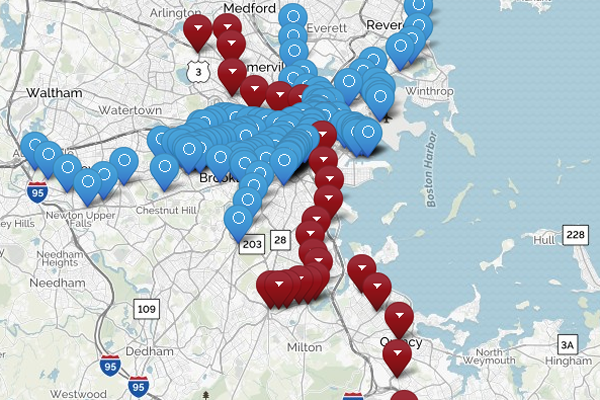
To see how the project looks, go to the top right corner and click on the circle. In the list, choose the Home option. This will show you a project list, select the Boston Subway map. Your map should be in Boston and several map markers should be displaying the locations of the subway stations.
Menu Button
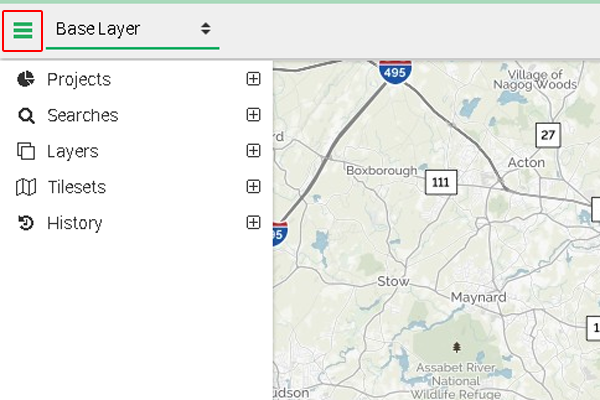
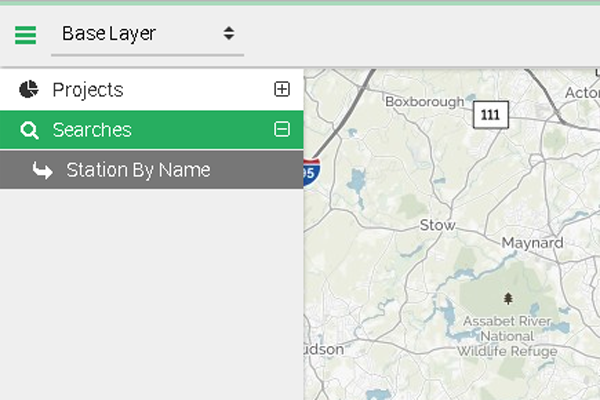
Let's go through the interface, starting with the toolbar at the top. On the left side, the button with three lines is the menu button. It opens and closes the side menu that is docked to the left side of the screen.

Layer Selector
The dropdown next to the menu button is the layer selector. In this instance, we only have Base Layers. Base layers are the default type for new layers. A project can also have feature sets, which will be listed individually in this dropdown. Feature sets work well for isolating specific data that you may not want rendered in conjunction with other data. Also, the History layer will appear in this list. When a project is set up to collect data, the History layer helps visualize where the collection forms have been gathered.
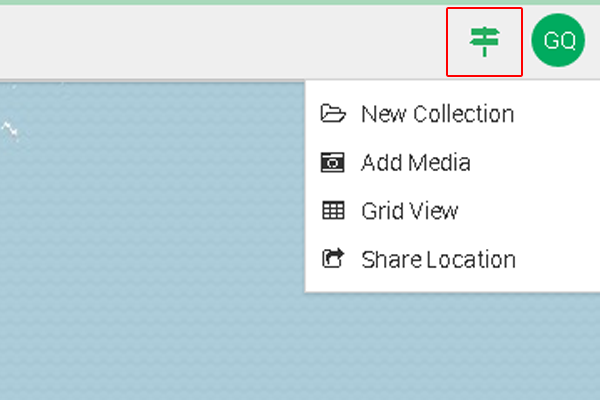
Actions Menu
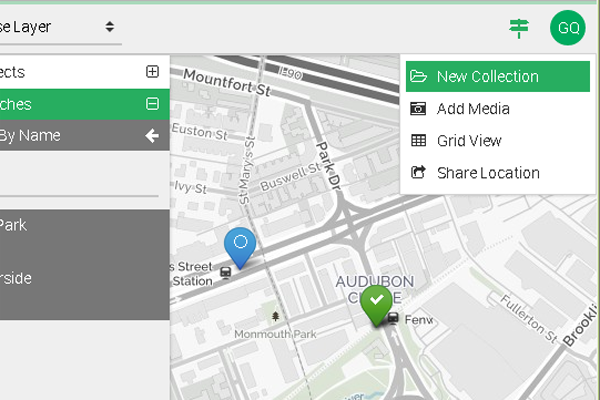
On the right side of the toolbar, you have a button with a road sign. This is the actions menu. Depending on the user permissions and the selected feature, this menu changes to display a list of actions that can be performed. Below is a description of available actions.
- New Collection - This is a new collection form using the coordinates of the currently selected feature on the map.
- New GeoCollection - This is a new collection form using the coordinates of the location tab in GeoSync GO Plus.
- Add Media - This action attaches media or links to the currently selected feature on the map.
- Grid View - This view allows you to see layers in a grid format with filtering capabilities.
- Share Location - This action generates a link that will share the currently selected feature if one is selected else it will just share the map position. If this is a private project, the link recipient will still need to have permission to view the map.
User Menu
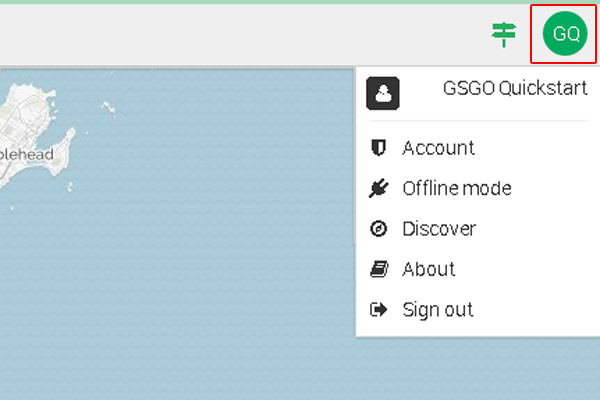
Next to the actions menu is a circle with the user's initials. This is the user menu. This list pertains to map settings and information. Below is a description of available actions.
- Account - This allows access to the back-end administration area. It is only available to users that are flagged as administrators.
- Offline mode - This option allows you to use GeoSync GO disconnected to the internet. This limits the functionality of the map, but collection activities will still work normally.
- Discover - This is a link to a search-enabled list of public map projects. It is a good place to see what people are able to do with GeoSync GO.
- About - This option displays version information and lists credits for software libraries used in GeoSync GO.
- Sign out - This will sign out the current user and return you to the sign in screen.
Side Menu
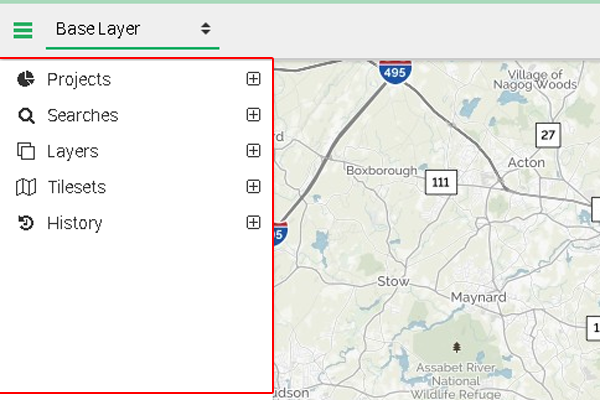
The next element we will cover is the side menu docked on the left side of the screen. This element consists of expandable sections with contextual actions. A list of available sections is below.
- Projects - This section lists all projects that the current user can access. Clicking on a project in this list will load it as the active project.
- Searches - This section lists all searches connected to the active project. Clicking on a search item will load the search interface into the section. The search interface will take search input and list search results that can be clicked to be viewed on the map.
- Layers - This section lists all base layers in the active project with a checkbox beside them. The checkboxes allow the user to toggle on and off layers that they wish to see.
- Tilesets - This section lists all tilesets in the active project with a checkbox beside them. The checkboxes allow the user to toggle on and off tilesets that they wish to see.
- Calendars - This section lists all calendars connected to the active project. Clicking on a calendar displays the calendar events in an overlay.
- History - This section shows all collection forms saved on the current device. Clicking on a history item will display it on the map.
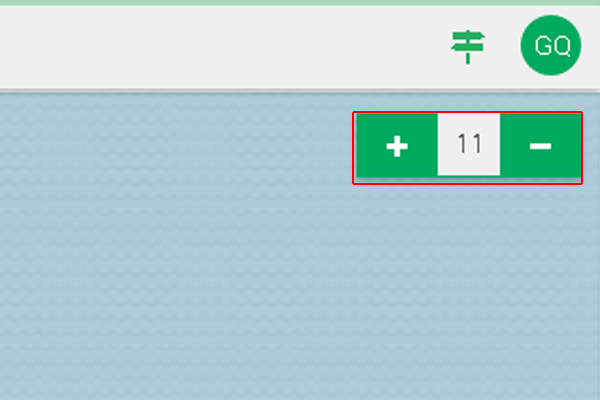
Zoom Controls
The zoom controls are located in the top right corner of the map. The + button zooms the map in. The - button zooms the map out. The number in the middle displays the current zoom level of the map.
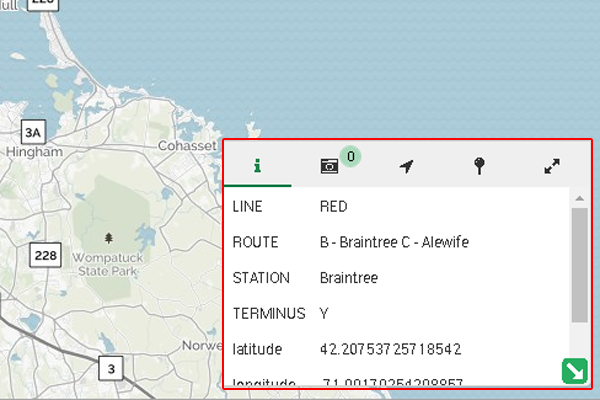
Feature Window
The next element to look at is the window in the bottom right corner. This window is sometimes hidden and can be opened by using the toggle button with an arrow icon. This is the feature window. This window has tabs across the top that provide contextual actions. A list of the tabs from left to right is below.
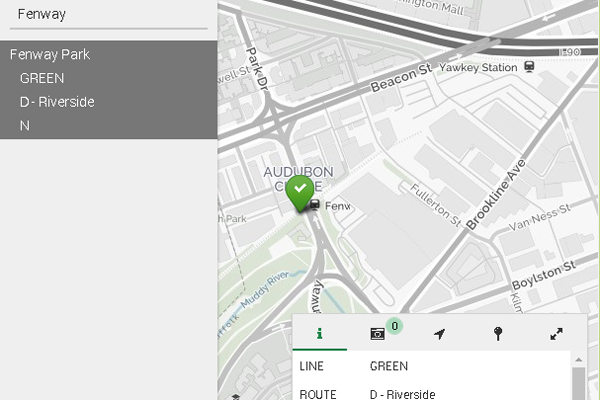
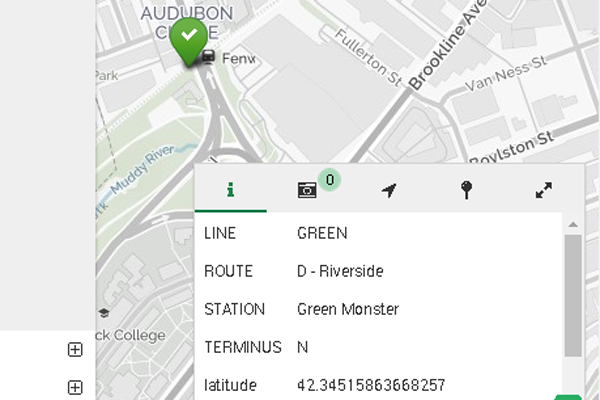
- Info - This tab lists all the properties of the currently selected feature.
- Media - This tab lists all media and links attached to the currently selected feature. Clicking on an item in this list will display a preview.
- Location - This tab controls the geolocation settings and information. By default, geolocation is off. Depending on the device being used, the settings on this tab will let you choose between the internal GPS sensor and an external GNSS receiver.
- Find - This tab lets you manually enter latitude and longitude values. The Find button will place a marker on the map at the provided location. The Directions button will show the point in Google Maps to allow access to routing information.
- Measure - This tab lets the user draw lines and shapes on the screen and provides measurement data based on the input.
Map WIndow
Last, but not least, the majority of the screen is covered by the map window. This displays the geographic data. The map responds to user input. A list of available inputs is below.
- Pan - Dragging the cursor (or a finger on a touchscreen) across the window moves the map to center on a new location.
- Zoom - Using the scroll wheel (or a pinch gesture on a touchscreen) will adjust the zoom level of the map.
- Feature Selection - Clicking on a feature will set it to be the selected feature. Any actions listed above that mention working on the selected feature will be determined by this input.
- User Marker - Right clicking (or a tap and hold gesture on a touchscreen) will set a new marker on the map at the given location. A popup in automatically shown when setting a user point. The left button starts a New Collection at the coordinates of the marker. The right button removes the marker from the map. No more than one user marker can be on the map.
Next Steps
Our simple project has some shortcomings. Currently, there are no searches or collection forms available in the project. Also, all the subway station markers look the same and don't provide much visual information. This section will go through the first steps of addressing these issues.
Layer Styling
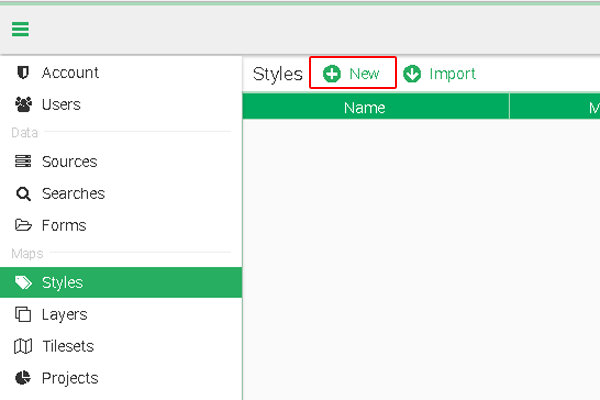
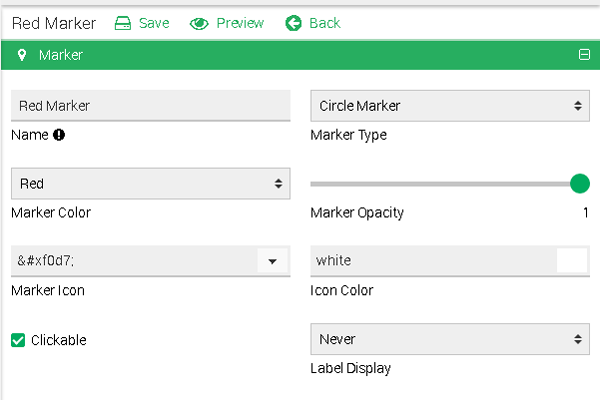
The subway stations are all color-coded based on the subway line they are connected to. Let's set the color of the station markers to match the color-coding. We will do this for one color, feel free to do the others on your own. In the top-right user menu, click account. Click on the Styles link in the left menu. Click the New link at the top to open the creation form. Set the Name to Red Marker. Set the Marker Type to Circle Marker. Set the Marker Color to Red. Click the Save link at the top to create the new style.
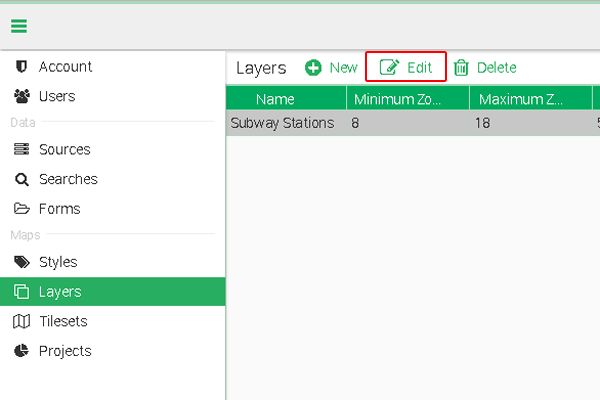
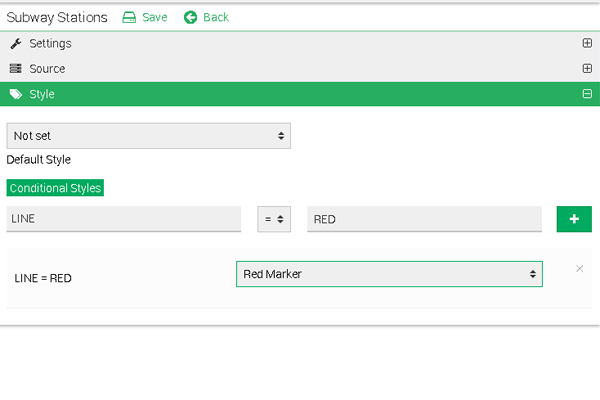
The new style is created, but now we have to use it in our subway station layer. Click on the Layers link in the left menu. In the list, select the Subway Stations layer. At the top, there should be an Edit link, click it. Open the Style section on the form. For this example, we will be using the Conditional Styles section. This lets you set a comparison of a feature property to a value. If the comparison is true for a feature, then the style of feature will be determined by this rule. Click into the Field input, click on the LINE option in the dropdown list. In the Value input, type RED. Click the + button at the end of the row to add the rule to the layer. In the list below, use the dropdown next to the new rule to set the style to Red Marker. Click the Save link at the top to save the changes to the layer.
Search Creation
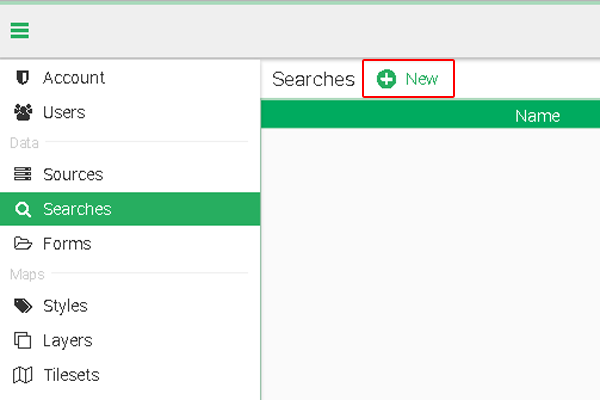
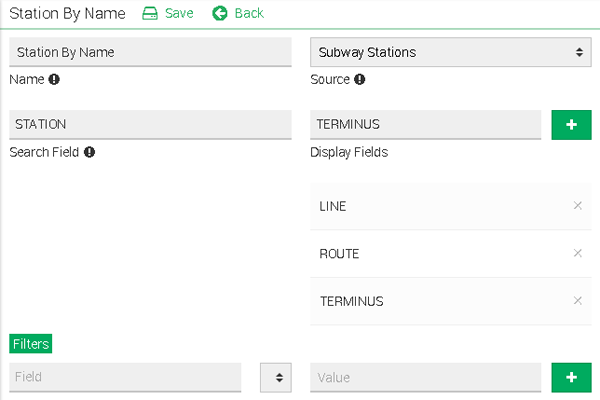
Searches reference an available data source to allow features to be searched by a specific property. Click the Searches link in the left menu. Click the New link at the top to open the creation form. Set the Name to Station By Name. Set the Source to the Subway Stations source. Click into the Search Field and select STATION from the list. Click into the Display Fields, select LINE and click the + button. Repeat for the ROUTE and TERMINUS fields. Under Display Fields, you should have a list containing LINE, ROUTE, and TERMINUS. Click the Save link at the top to create the new search.
We still need to connect the search to our project. Click on the Projects link in the left menu. In the list, select the Boston Subway. At the top, there should be an Edit link, click it. Expand the Searches section. Select the Station By Name option in the dropdown and click the + button. Click the Save link at the top to save the changes to the project.

Customizing Forms
The Forms section is a recent addition that may not be available to your account. If it is not there on your account, please ignore this section. A Form defines the data that we want to be captured in the field and connects it back to our data source. We will create a simple form to update the name of a subway station.
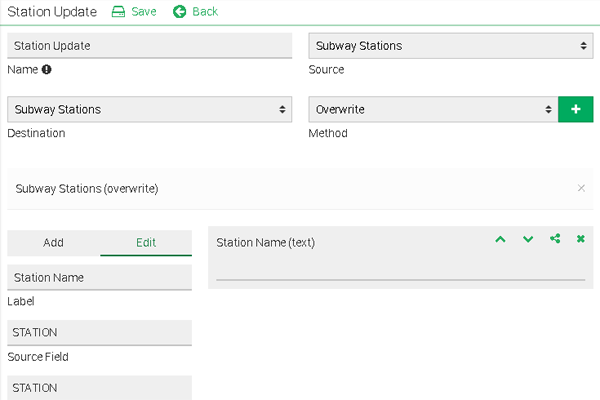
Click the Forms link in the left menu. Click the New link at the top to open the creation form. Set the Name to Station Update. Set the Source to the Subway Stations source. The Source determines how the fields are populated in the collection form. If a feature is selected it will reference the source fields to pre-populate data into the form. The destination and method determine how the data is saved. The destination can be any data source. In this case, we will save it back to our Subway Stations source, so set the dropdown to Subway Stations. In other situations, you might be doing inspections and want to gather the reports in a separate data source that will not effect the feature data. Our method for this, will be Overwrite. This will replace the feature with our new data from the collection form. In other instances, you can use Append to create a history of changes to a feature or to keep accumulating inspection reports. When you have the Destination set to Subway Stations and the method set to Overwrite, click the + to add the destination.
Now to build the form. The options on the left are field types. The right side will display a preview of your form. For simplicity, we are just going to create one field. On the left side, click the Text button. On the right, click on the New Field item. On the left, click on the Edit tab at the top. Set the Label to Station Name. Click into the Source Field and select STATION from the list. Click into the Destination Field and select STATION from the list. Click the Save link at the top to create the new form.
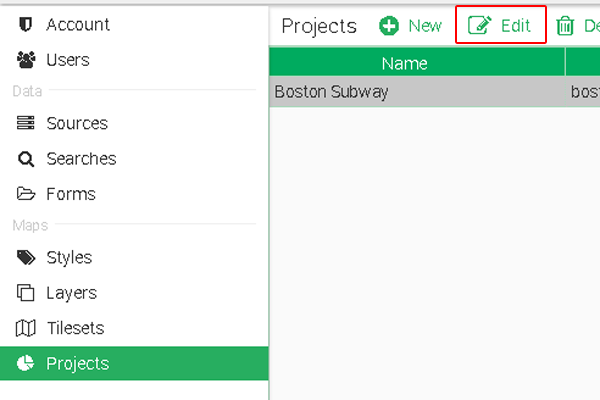
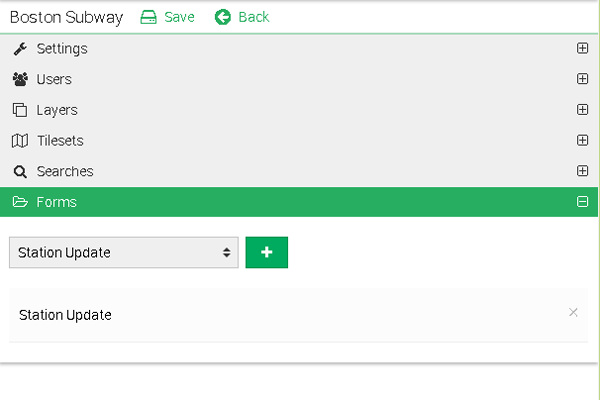
We still need to connect the form to our project. Click on the Projects link in the left menu. In the list, select the Boston Subway. At the top, there should be an Edit link, click it. Expand the Forms section. Select the Station Update option in the dropdown and click the + button. Click the Save link at the top to save the changes to the project.

Testing Our Changes
Go to the top right corner and click on the circle. In the list, choose the Home option. Choose Boston Subway from the project list. When the project loads, we should immediately see our style changes. Some of the markers should be colored red.
Next, let's check out our new search. In the left menu, expand the Searches section. Click on the Station By Name search. In the search field type Fenway and hit enter. There should be one result and clicking on it should take you to the Fenway Park subway station on the map.
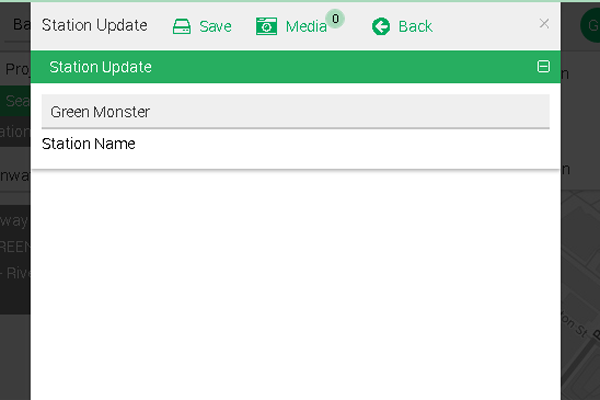
Last, if you were able to setup a new form, try opening the actions menu at the top and clicking on the New Collection option. Select Station Update from the list. The new form should open and the Station Name should be set to Fenway Park. At the top, notice that media can be attached directly to the form. Change the Station Name to the Green Monster and click the Save button at the top.
On the map, click on another marker and then back on the Fenway Park marker. You should now see that the STATION field is set to Green Monster.
Conclusion
This quickstart is about understanding the basic functions of GeoSync GO Plus. The key to building a great map is replicating and combining the steps above to create meaningful visual styles and detailed collection forms. We urge you to explore the public maps area and hope that you continue to work with GeoSync GO Plus. As you move forward, use the Help section on this website to find more articles on specific topics.